


Species Account for Comibaena bajularia
previous species | next species
Maps produced by MapMate®. Data overlays Copyright © Essex Field Club 2026.
Reproduction for study and non-profit use permitted, all other rights reserved.
Missing records?
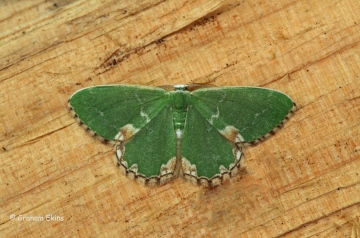
Comibaena bajularia ([Denis & Schiffermüller], 1775) 70.300
Blotched Emerald
Lepidoptera: macromoths: Geometridae
Reproduction for study and non-profit use permitted, all other rights reserved.
Taxonomic group: larger moths (Lepidoptera: macromoths) - County data
View time series maps for Comibaena bajularia
member log-on for taxon report
Verification Grade:
Adult:
Adult: Distinctive
Records: 984
First Record: 1906
Latest Record: 2025
1992-on hectads: 49
Pre-1992 hectads: 24
Total hectads: 51
Images
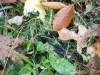
Comibaena bajularia Blotched Emerald 1

Blotched Emerald 3

Blotched Emerald 2

upload a new image
Comibaena bajularia on UK Moths website
Habitats
Broad Habitat Data (based on 198 records with habitat information)
Broad subhabitat Data (based on 4 records with subhabitat information)
no structural habitat data available
Habitat Detail and Method (based on 984 records with habitat detail and method information)
Recorded management for locations with Comibaena bajularia
Recorded substrate and hydrology for locations with Comibaena bajularia
Why not join the Club, register and add a new species page
Interpretation of distribution maps